Soil
Six environmental indicators monitor the development of soil as an environment good. These are the amount of municipal waste and its recycling, the size and growth of settlement and transport areas, the part of recreational spaces within settlement and transport areas, raw material productivity, the percentage of the ecological agricultural area within the total agricultural area and surface nitrogen balance.
Municipal waste and recycling
Definition:
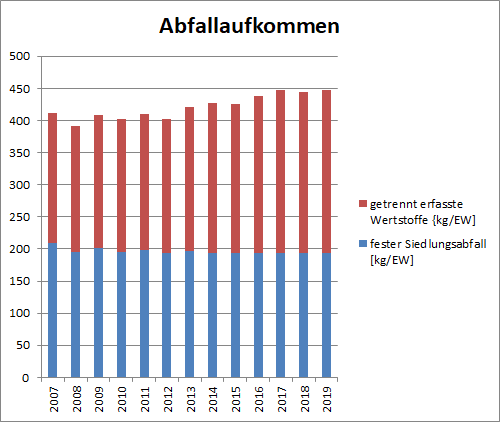
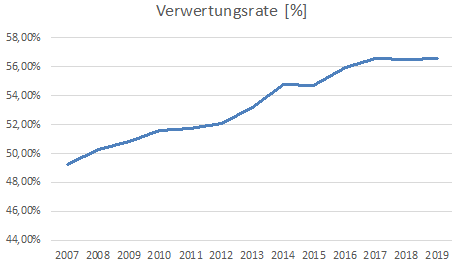
Municipal waste includes all household waste as well as other waste that is similar to household waste due to its nature or composition or the way it can be disposed of. It is recorded in kilograms per inhabitant per year. The sub-fractions covered include household waste, bulky waste, paper, cardboard, cardboard packaging (PPK), container glass, lightweight packaging and organic waste. Some of these are recyclable materials that can be reprocessed. The recycling rate in per cent is calculated from the quotient of the sums of the recyclable material fractions in relation to total municipal waste. A decreasing volume of waste and an increasing recycling rate indicate lower resource consumption and hence less impact on the soil as an environmental good.
Condition of the environment and development:
The recycling rate has increased steadily since 2007. Until 2012, the amount of waste fluctuated around 400 kg/inhabitant but has been growing since then. A higher volume of organic waste as part of the separately collected recyclable materials is, among other things, the reason for this. .
Charts and tables:
| Jahr | solid municipal waste [kg/inhabitant] | separately collected recyclables [kg/inhabitant] | recycling rate [%] |
|---|---|---|---|
| 2007 | 209 | 203 | 49,27 |
| 2008 | 195 | 197 | 50,26 |
| 2009 | 201 | 208 | 50,86 |
| 2010 | 195 | 208 | 51,61 |
| 2011 | 198 | 212 | 51,71 |
| 2012 | 193 | 210 | 52,11 |
| 2013 | 197 | 224 | 53,21 |
| 2014 | 193 | 234 | 54,80 |
| 2015 | 193 | 233 | 54,69 |
| 2016 | 193 | 245 | 55,94 |
| 2017 | 194 | 253 | 56,60 |
Source: TLUG, Waste Management Balance Sheet 2016: Table 3 Development of the resident specific waste and recyclable material volume in Thuringia from 2007 to 2016
Settlement and transport areas
Definition:
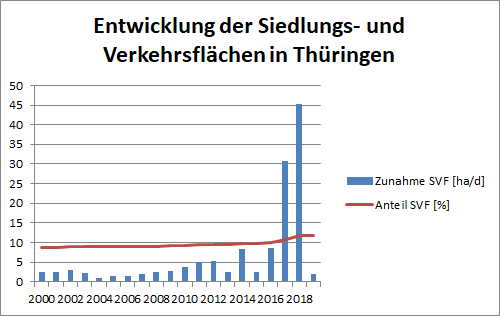
Settlement and transport areas are shown as a percentage of the total area of Thuringia. This conditional indication ensures comparability between the federal states. Moreover, the additional daily use of land for settlement and transport areas is recorded. It is calculated from the total annual increase in settlement and traffic areas divided by 365 days. High or increasing values of these indicators mean an irretrievable loss of land and open spaces for the sustainability of land use. Severe impacts are also to be expected for the environmental goods climate/air (e.g. traffic) and water (e.g. sealing).
State of the environment and development:
According to the European agreement, the daily increase in settlement and traffic areas in Germany is to be decreased to 30 hectares by 2020. Accordingly, the goal for Thuringia would be to reduce the daily growth to approx. 1 ha. By 2004, this target value had even been achieved but was not maintained. Since then, it has been increasing again considerably. Over a period of 15 years, the highest value was reached in 2012. Among other things, this is due to a statistical effect, with a complete comparison of types of use being carried out as part of a system changeover in 2011/2012. After its completion, the growth rate of 2.58 % returned to the usual range but is still too high for the 2020 target. Another "statistical high" followed in 2014. Due to the reclassification of some areas as part of the adaptation to the ALKIS usage type registration, no exact comparison with previous years is possible. (The 2014 data are provisional until confirmed by the TLS).
Chart and table:
| Jahr | Increase SVF [ha/d] | ShareSVF [%] |
|---|---|---|
| 2000 | 2,6 | 8,8 |
| 2001 | 2,4 | 8,8 |
| 2002 | 3,0 | 8,9 |
| 2003 | 2,3 | 9,0 |
| 2004 | 1,0 | 9,0 |
| 2005 | 1,6 | 9,0 |
| 2006 | 1,6 | 9,0 |
| 2007 | 2,0 | 9,1 |
| 2008 | 2,5 | 9,1 |
| 2009 | 2,7 | 9,2 |
| 2010 | 3,7 | 9,3 |
| 2011 | 5,1 | 9,4 |
| 2012 | 5,4 | 9,5 |
| 2013 | 2,6 | 9,6 |
| 2014 | 8,3 | 9,7 |
| 2015 | 2,5 | 9,8 |
Source: Sustainability Committee Thuringia. Indicator Report 2017: p. 12 Indicator No. 5
Recreation areas
Definition:
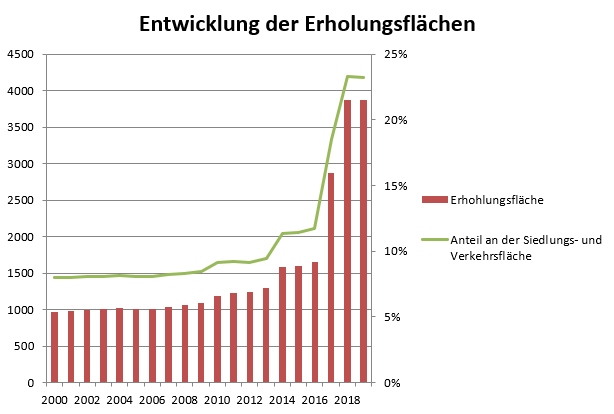
Recreation areas are understood as undeveloped areas within the regional centres of urbanised areas. Urbanised areas are defined as "an abstract of regions with regional centres with more than 100,000 inhabitants or a population density larger than 150 inhabitants/km² and with a minimum density of 100 inhabitants/km²". (LIKI Newsletter No.4, 2005). Accordingly, the recreation areas in Erfurt, Jena, and Gera are recorded for Thuringia. They are presented as part of the settlement and transport areas. Until 2013, verification of the actual types of use in the land survey register was based on a recoding of the types of use from the computer-aided property documentation (COLIDO) of the former GDR. These land-use inventories were not identical. Hence, the automatic transfer of the data resulted in technically incorrect images, which will be checked and corrected as part of the continuation of the cadastre. From 2014, the data will be taken from the official land survey register information system ALKIS®. So far, the actual use has only been continued as required in the context of a property survey. In order to update the information on actual use, an initial update from the basic DLM (digital landscape model) and the evaluation of digital orthophotos (DOP) will be carried out by the end of 2018. The resulting changes in types of use limit the comparability with the previous year's results.
State of the environment and development:
The amount of recreational areas is continuously increasing and can be interpreted as a trend; a further increase is likely. The increase in recreational areas has a positive effect on the soil, groundwater formation, the greening of urbanised areas, and thus on biodiversity and, last but not least, on human health. Since 2014, as a result of the latter aspect, built-up areas used for recreation have also been added to recreational areas. As a consequence, the recreational area is only comparable with previous years to a certain extent.
Chart and table:
| Jahr | SVF | Recreation areas | Share of the settlement and transport area |
|---|---|---|---|
| 2000 | 12204 | 973 | 7,97% |
| 2001 | 12252 | 981 | 8,01% |
| 2002 | 12303 | 992 | 8,06% |
| 2003 | 12410 | 1002 | 8,07% |
| 2004 | 12452 | 1018 | 8,18% |
| 2005 | 12504 | 1013 | 8,10% |
| 2006 | 12566 | 1012 | 8,05% |
| 2007 | 12634 | 1036 | 8,20% |
| 2008 | 12727 | 1057 | 8,31% |
| 2009 | 12809 | 1087 | 8,49% |
| 2010 | 13054 | 1189 | 9,11% |
| 2011 | 13250 | 1224 | 9,24% |
| 2012 | 13578 | 1242 | 9,15% |
| 2013 | 13689 | 1290 | 9,42% |
| 2014 | 13887 | 1581 | 11,38% |
| 2015 | 13934 | 1592 | 11,43% |
| 2016 | 14124 | 1655 | 11,72% |
| 2017 | 15640 | 2871 | 18,36% |
| 2018 | 16648 | 3874 | 23,27% |
| 2019 | 16649 | 3868 | 23,23% |
Source: Thuringian State Office for Statistics; tables settlement and transport areas by type of use and districts in Thuringia, areas by type of actual use by districts from 2015 in Thuringia
Raw material productivity
Definition:
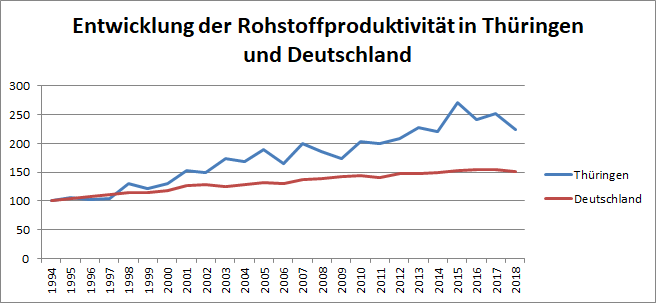
Raw material productivity expresses how much economic output (GDP) is "produced" by using a unit of non-renewable raw materials. To calculate the "raw material productivity" indicator, the gross domestic product (adjusted for price, chained indices) is set into relation with the consumption of non-renewable raw materials, measured as direct material input (abiotic). This variable is presented as an index, based on the practice of national accounts, which are responsible for calculating the gross domestic product. The year 1994 was selected as the reference year because doubling the raw material productivity in 1994 is one of Germany's sustainability goals up to 2020. Non-renewable raw materials include energy sources (coal, crude oil, natural gas, etc.) as well as minerals (ores, stones, and earths) and their products.
Condition of the environment and development:
Raw material productivity increases when an economic performance is achieved with less material expenditure. This means less space, material, and energy consumption, material relocation, as well as pollutant emissions. The objective is to double raw material productivity by 2020, and Thuringia has reached this goal thanks to its structurally constant positive development.
Chart and table:
| Year | Thuringia | Germany |
|---|---|---|
| 1994 | 100,0 | 100,0 |
| 1995 | 106,6 | 105,0 |
| 1996 | 102,4 | 107,9 |
| 1997 | 105,3 | 110,8 |
| 1998 | 130,8 | 114,7 |
| 1999 | 122,9 | 115,0 |
| 2000 | 132,0 | 119,2 |
| 2001 | 154,5 | 127,5 |
| 2002 | 151,5 | 128,9 |
| 2003 | 175,9 | 126,6 |
| 2004 | 169,6 | 128,5 |
| 2005 | 191,1 | 132,0 |
| 2006 | 166,0 | 130,6 |
| 2007 | 202,1 | 137,3 |
| 2008 | 189,1 | 140,4 |
| 2009 | 176,2 | 144,3 |
| 2010 | 206,0 | 145,9 |
| 2011 | 201,6 | 141,8 |
| 2012 | 209,8 | 149,2 |
| 2013 | 228,8 | 148,7 |
| 2014 | 223,9 | 150,3 |
| 2015 | 275,5 | 154,4 |
| 2016 | 245,3 | 155,4 |
Source: Länderinitiative Kernindikatoren: D6 - Resource productivity, Table: Resource productivity as index [1994=100%]
Ecological landscape
Definition:
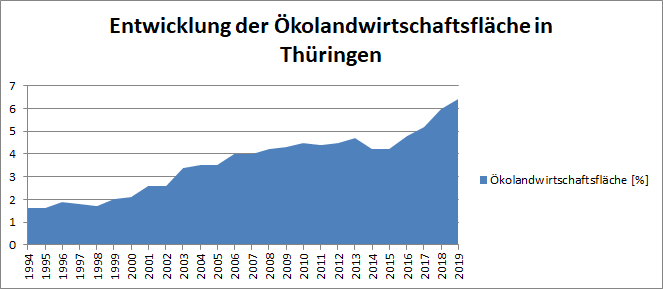
Organic farming shows the part of the land of the agriculturally used areas, which is cultivated according to the EU-Eco-regulation.
Significance and development:
Increasing natural soil fertility through cultivation measures, which take the laws of soil regeneration and the long periods of soil formation into account, are the foundation for long-term productivity and thus sustainable economy. The consistent renunciation of the use of non-natural chemical-synthetic substances protects the waters and contributes to the diversity of species and biotic communities.
Chart and table:
| Jahr | Organic farming area [%] |
|---|---|
| 1994 | 1,6 |
| 1995 | 1,6 |
| 1996 | 1,9 |
| 1997 | 1,8 |
| 1998 | 1,7 |
| 1999 | 2,0 |
| 2000 | 2,1 |
| 2001 | 2,6 |
| 2002 | 2,6 |
| 2003 | 3,4 |
| 2004 | 3,5 |
| 2005 | 3,5 |
| 2006 | 4,0 |
| 2007 | 4,0 |
| 2008 | 4,2 |
| 2009 | 4,3 |
| 2010 | 4,5 |
| 2011 | 4,4 |
| 2012 | 4,5 |
| 2013 | 4,7 |
| 2014 | 4,2 |
| 2015 | 4,2 |
| 2016 | 4,8 |
| 2017 | 5,2 |
| 2018 | 6,0 |
Source: Länderinitiative Kernindikatoren: D2 - Organic agriculture, Table part of the land of the agriculturally used areas
Surface area nitogen balance
Definition:
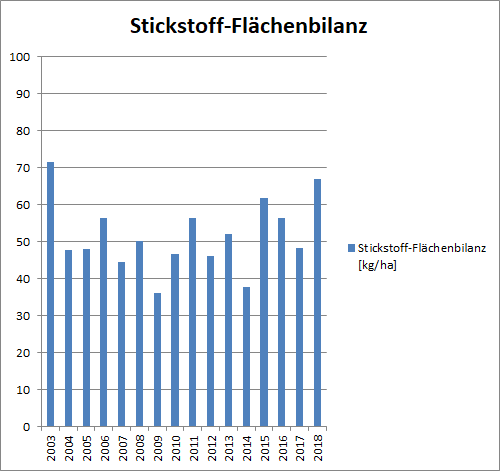
The surface nitrogen balance represents the difference between nitrogen supply and nitrogen removal. Nitrogen is supplied by commercial fertilisers, from farm manure, from waste (sewage sludge, compost, or the like), and nitrogen fixation by legumes. Removal takes place with the harvested crop (removal of crops), minus any crop residues left in the fields (e.g. straw, beet leaves) and through grazing.
Significance and development:
The surface nitrogen balance does not show a clear trend due to the weather-related fluctuation. Thus, the extremely high value in 2003 was the result of a very hot summer. The surface nitrogen balance is used in agriculture as the starting point for further fertiliser supply. The higher the balance, the less fertiliser is needed for subsequent cultivation. A lower nitrogen supply has a positive effect on the natural balance of the soil, groundwater, and neighbouring waters. For the 2028 to 2032 period, the German sustainability strategy (2016) aims to achieve an average reduction per annum of excess nitrogen to 70 kilograms per hectare of agriculturally used land in the overall balance for Germany. Thuringia has already been below this figure since 2004.
Chart and table:
| Jahr | surface nitrogen balance [kg/ha] |
|---|---|
| 2003 | 70,8 |
| 2004 | 47,2 |
| 2005 | 47,3 |
| 2006 | 55,8 |
| 2007 | 43,8 |
| 2008 | 49,4 |
| 2009 | 35,6 |
| 2010 | 45,9 |
| 2011 | 55,8 |
| 2012 | 45,3 |
| 2013 | 51,3 |
| 2014 | 36,7 |
| 2015 | 61,0 |
| 2016 | 55,7 |
| 2017 | 48,1 |
Source: Länderinitiative Kernindikatoren: B6 - Excess nitrogen, Table Excess nitrogen on agriculturally used land in Germany